Beer
A word that carries memories of aromas, foam, good times, and a tad bit of a bitter taste. Is there anything better than cracking a cold beer on a sweaty, thirsty hot day at the beach, or chugging on IPA while cheering for your favorite sports team? The answer is no! Or at least according to 40% of drinkers in America, which makes :beers: beer the most popular alcoholic beverage in the United States. It has been the case since the 90’s at least according to Gallup, except for 2005 when wine took over briefly. But don’t let the stats fool you: America’s love story with beer goes way back - even before Europeans settled on the continent! This means the golden beverage has witnessed centuries of American history, from early European settlements until the inception of the United States, to recent times including the Prohibiton and finally the Internet Age. The first thing that comes to mind is that beer probably went through some changes during these 400 years. But is that what actually makes beer special to America? Hold my beer. What if the perception of beer in the common American memory was the real treasure here? Every generation perceived beer in the light of its own era, depending on the technologies available at the time. The result is a diverse heritage consisting of books, maps, and more recently, blogs. So how does the Internet carry the heritage of American beer? Here is our attempt to answer by resuming the early history of American beer, then analysing blog datasets in search for traces of that history in today’s younger minds.
Beer and America
Today, American beer comes in all shapes and forms. You have the choice between American lager, American pale ale, American Irish pale ale (or simply IPA), cream ale, American stout, American brown ale, and the list goes on! Now that you’ve chosen your beer, would you like it in a glass bottle? Or a can? Or perhaps draught in a jug? The beer industry today is simply gigantic and it is hard to keep track. Every single shop in the world has a beer fridge, major sports events around the globe are sponsored by beer, we even say “cheers” to say “thanks” or “goodbye” now what is happening here! It’s more than just beer, it’s culture. Now follow us to know how it all came to be.

- As early as the 10th century, Native Americans knew about fermented beverages and were already brewing various kinds of traditional beers from corn [1]. It is hard to imagine for most Americans but following the arrival of the first Europeans, the Natives taught them their own way of making beers.
- Corn beer lasted until the early 17th century, when the first English and Dutch settlers entered the American continent [2]. Settlers started brewing ale at home, and the first Taverns of the New World saw the light. The beer business was still small and local back then as ale made in Europe was considered of higher quality, and was too expensive.
- In the 19th century came the lager revolution. With the big waves of German immigrants coming to North East America and after the end of the Civil War, the US saw a huge increase of beer popularity. If you’re still not convinced the Germans caused the industrialization of beer in the US, here are some stats: the 1880 Census showed that 80.5 percent of the brewers were of German descent and the beverage industry had the heaviest German concentration among male employees [3]. The 19th century also saw the birth of some of America’s biggest beer companies like Anheuser-Busch and Pabst, who still dominate to this day.
- Enter the Prohibition. From 1920 to 1933, a nationwide constitutional law prohibited the production, importation, transportation, and sale of alcoholic beverages including beers. In case you’re wondering why America went crazy at the time, the KKK counted ~3M member by the mid 1920’s [4]. In the aftermath of the Prohibition, counties were allowed local control of alcohol. That means that each county became free to chose whether they wanted to keep the alcohol ban, or drop it. Counties that dropped the ban are called “wet”, in opposition to “dry” counties where alcohol is still completely prohibited. Today, the US count 83 dry counties, home to ~1.7 million Americans, or 0.5% of the U.S. population [5].
- It’s been a long way since the Prohibition’s dark days. Nowadays, the US count more than 7’000 breweries, which range in size from industry giants to craft breweries. In 2021, 81% of all beer was domestically produced in the U.S, 13% of which was produced by craft breweries [6].
Beer and the Internet

Do we know how the average American from 1800 felt about beer at the time? There aren’t even records of how much beer was brewed per year before 1800! That is why we find it fascinating that anyone can give their opinion about any beer on the Internet, which will keep it forever (forever ever?). We extracted data from two of America’s biggest beer rating websites, BeerAdvocate (BA) and RateBeer (RB), to analyse and process Amerian users’ ratings and reviews of a wide range of American beers. Let’s start with a quick exploration of our datasets.

Here are the top 20 beers that users review. We notice that on the one hand, BeerAdvocate users tend to review beers that are the most preferred as the mean ratings are significantly high: above 4 out of 5. On the other hand, RateBeer users tend to review more mainstream beers, like Budweiser and Heineken with 1.5 and 2.1 average ratings respectively.

 We also generated word clouds from the reviews to check the words with highest occurences. As expected, we can see a stark difference between bad reviews (rating of 1/5) where beer is described as “watery”, “light”, “metallic” and “cheap”, and excellent reviews (rating 5/5) where meliorative sensory terms are employed, like “aroma”, “fruity”, “fresh” and “hoppy”.
Heritage and Actuality
Let’s recap. We went through America’s beer history, from the arrival of ale to the emergence of lager with German immigrants, to the Prohibition then recent times where the market is booming. We also explored our American beer dataset, which contains Internet users’ opinions about today’s beer. But can we still find traces of the American beer heritage in modern beer rating websites?
Ale vs Lager
The question of the century. Ale or lager? We’ve seen that ale precedes lager on the historical beer timeline. We also know that lager single-handedly caused the industrialisation of beer. But which is more popular on the websites? Ale or lager? We let the people decide.
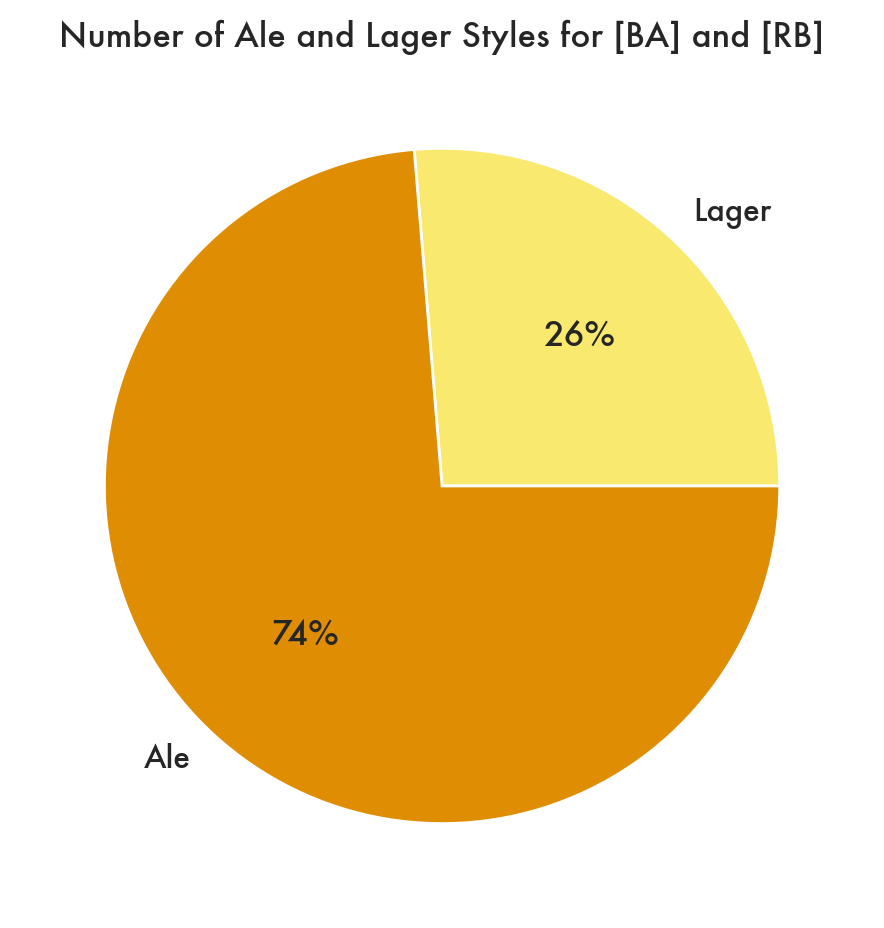
When it comes to beer styles counts, we can already see that ale comes in way more style variety than lagers on BeerAdvocate and RateBeer. This means that users tend to review different ale styles rather than lager styles. Lager seems to be considered more of a mainstream beer for beer connoisseurs, who would rather explore new tastes in the ale dimension.
But what happened to the lager children, descendants of the mighty German immigrants? Do they still prefer their traditional lager beers over West European ale? In an attempt to answer, let’s look at the “American German Belt”. The Belt defines the area with densest German immigrant populations during the 18th century. It includes North Eastern states like Wisconsin, Minnesota, Ohio, Illinois, Michigan, Pennsylvania, and Iowa.
")
The top map details the German immigration in the US circa 1872 [3], while the bottom map visualizes the commitment of users across America with respect to produced beer made by their own state. To be precise, we’re showing the number of local reviews within every state, divided by the state’s population, multipied by 1000, to finally get the local reviews per capita (‰) for each state. (A local review defines a review on a beer that was produced in the user’s state). It is fascinating to see that German Belt users are still committed to their local beer scene even though lager became mainstream across the whole country! Beer is clearly still part of the culture there, and people are clearly involved when it comes to expressing their opinion about their local beers.
But is the German Belt population still as interested in lager as back in the day? Let’s check the reviews volume first and compare it to the rest of the states:

We see no significant difference in review counts between the Belt and the rest, so the Belt does not tend to review lager more often. What about the ratings? Is the Belt prone to give better ratings to lager beer because of their cultural heritage? We aggregated the ratings across both websites to compute the average ratings of ales and lagers by the Belt across the years between 2002 and 2016.

As the top graph shows, Belt users tend to rate ale better than lager, even though lager has catched up in recent years. Now looking at the difference between ratings from the German belt and the rest of the states (rest - belt), we see that the difference is negative. This means that Belt users tend to rate beers slightly better than the rest of the states, especially lagers between 2001 and 2011. But in recent years it seems like the difference is minimal (-0.025). So overall, it is hard to come to a definitive conclusion about German Belt users preferences. Beer styles evolve over time, just like users’ preferences. We can not conclude that Belt users like lager better than other users, but we can say that beer is definitely still embedded in the local culture.
Traces of Prohibition and more
On to a more recent topic. We know the influence of the Prohibition era, which happened 100 years ago, is still prevalent in the way Americans consume beer today, since some states still have dry counties where alcohol is prohibited.
We hypothesize that dry states are more likely to give less favourable beer reviews in general, and particularly for beer that comes from wet states.
In order to confirm or reject this hypothesis, we conduct two statistical tests: a linear regression that predicts the beer rating given a categorical attribute as input and an independent t-test on the sample means.
The first categorical attribute that we analyze is whether the beer rating comes from a dry state. Since there are no completely dry states in the US as of 2022, we have considered states that contain dry counties as “dry states”. The dry states are Arkansas, Florida, Georgia, Kansas, Kentucky, Mississippi, South Dakota, Tennessee, Texas [8].
In the linear regression, we find that there is a negative correlation between being in a dry state and writing a positive beer review. The t-statistic corresponding to this attribute is -8.45 (with a p-value of 3x10-17), which is statistically significant and confirms our initial hypothesis. For the independent t-test comparing the means, we obtain the same p-value.
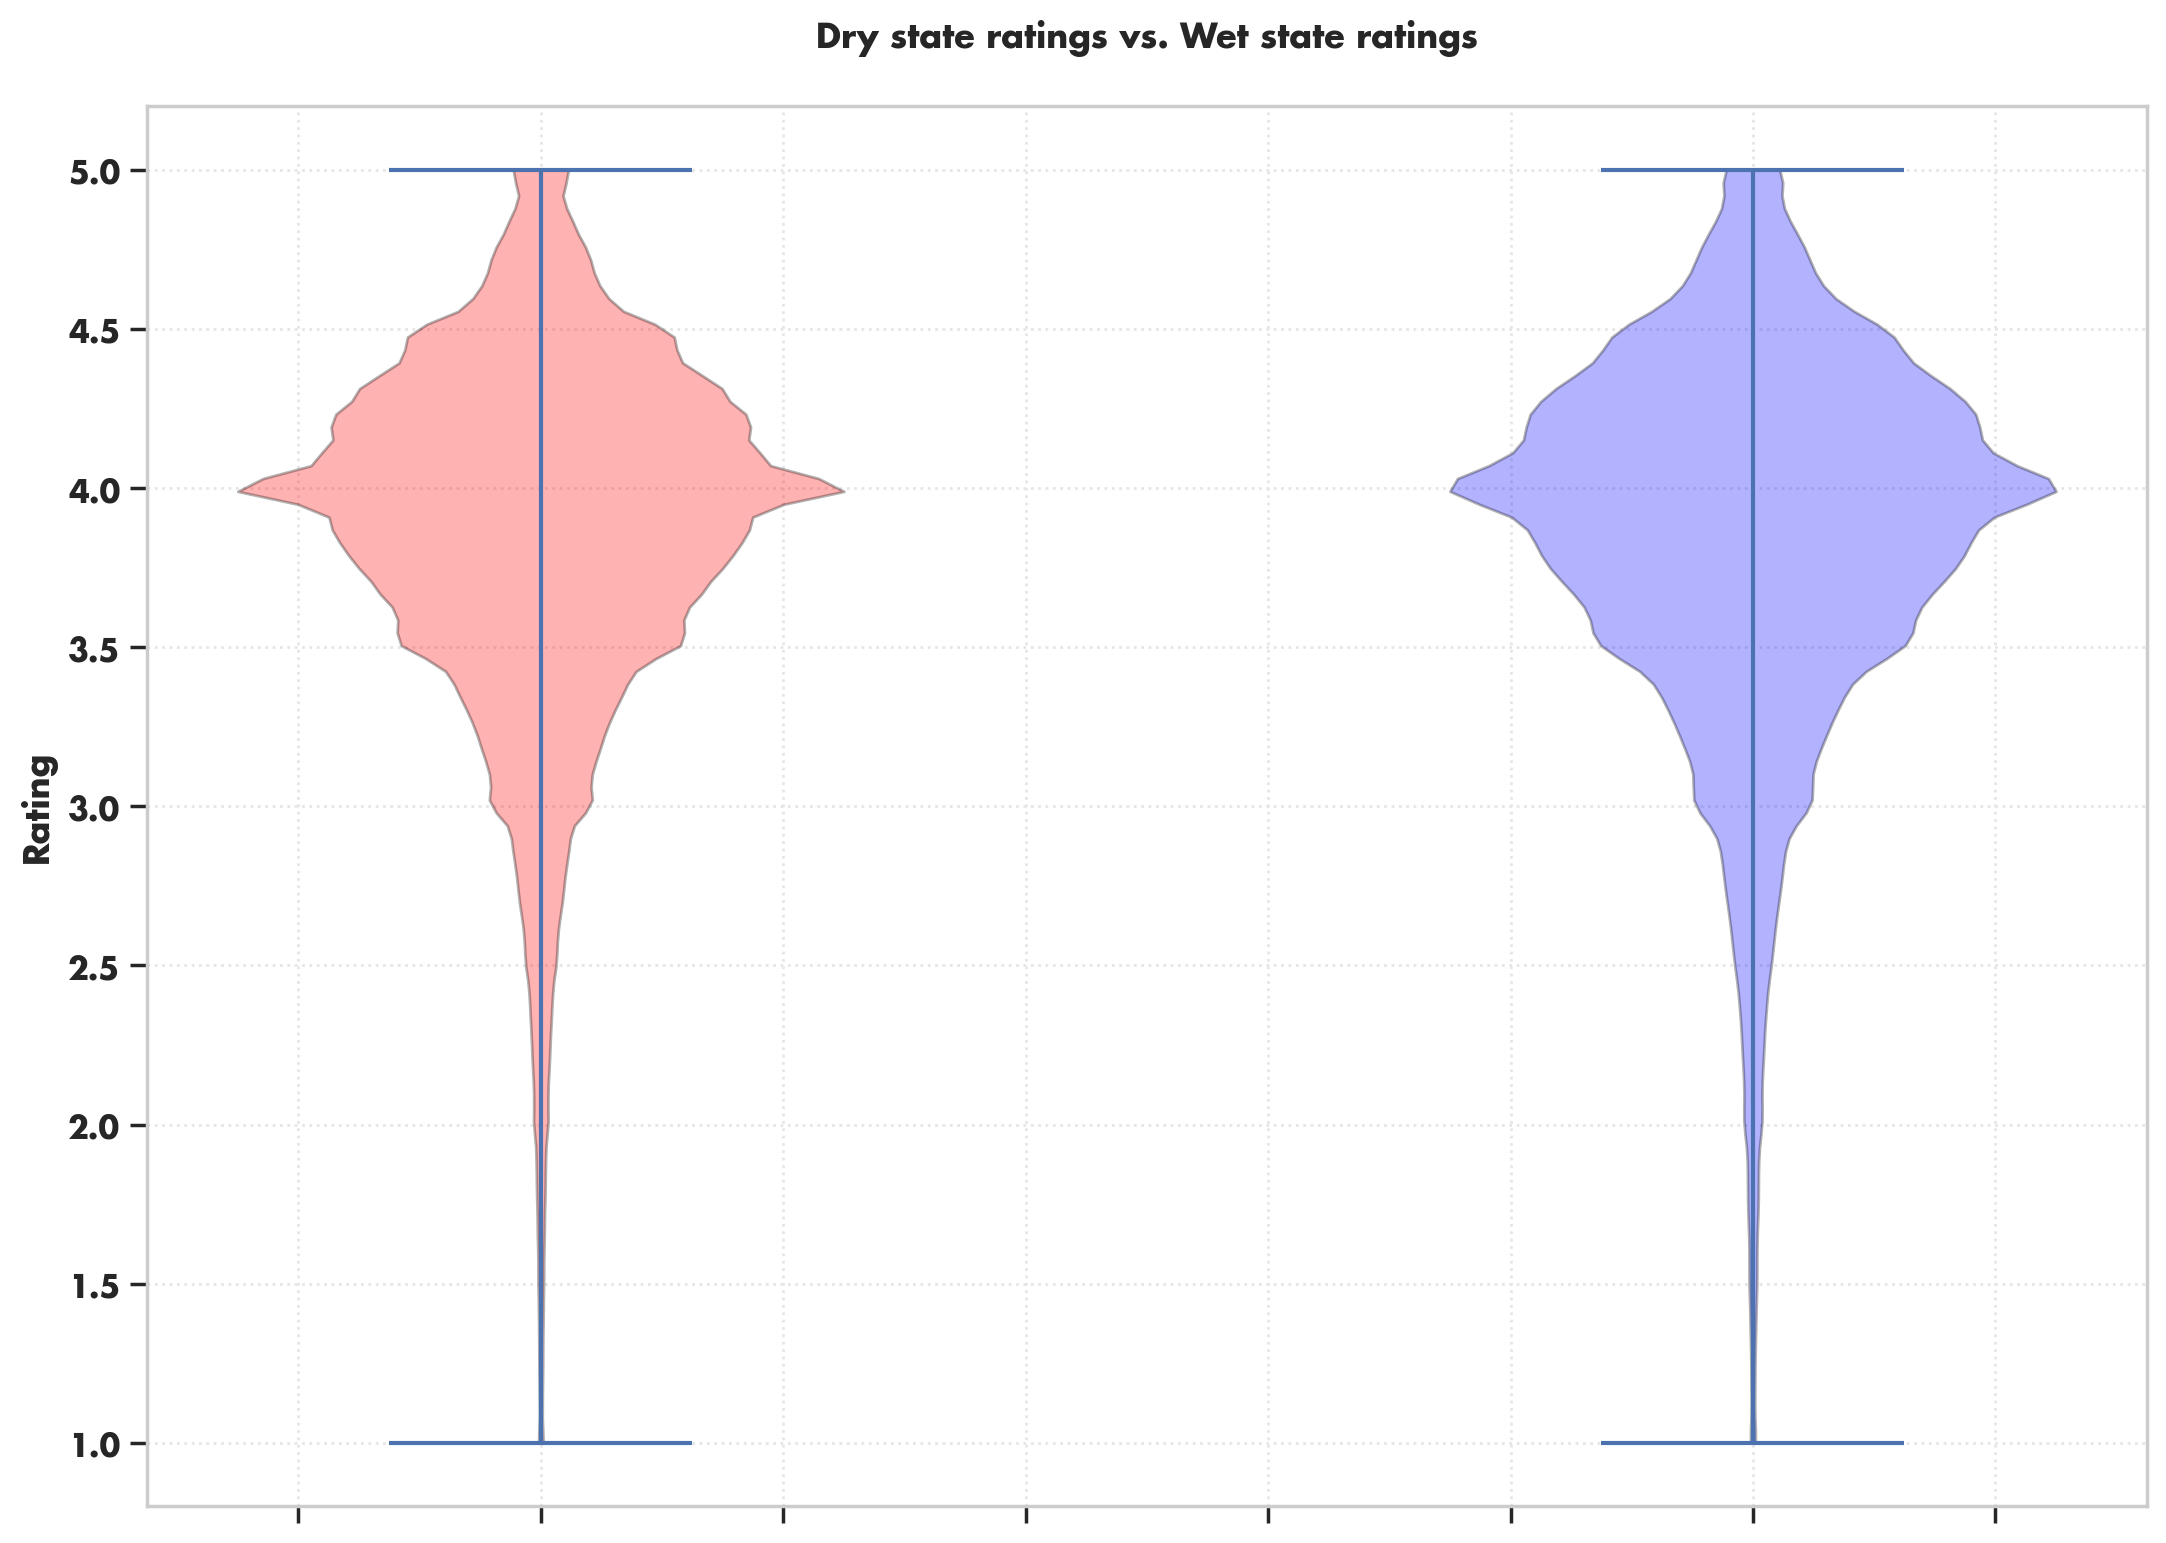
As we can see in the violin plots above, the ratings distributions are normal which means the t-test is valid.
The second categorical attribute that we would like to take a closer look at is described as follows: we consider ratings written by a user coming from a dry state who is rating a beer that was brewed in a wet state.
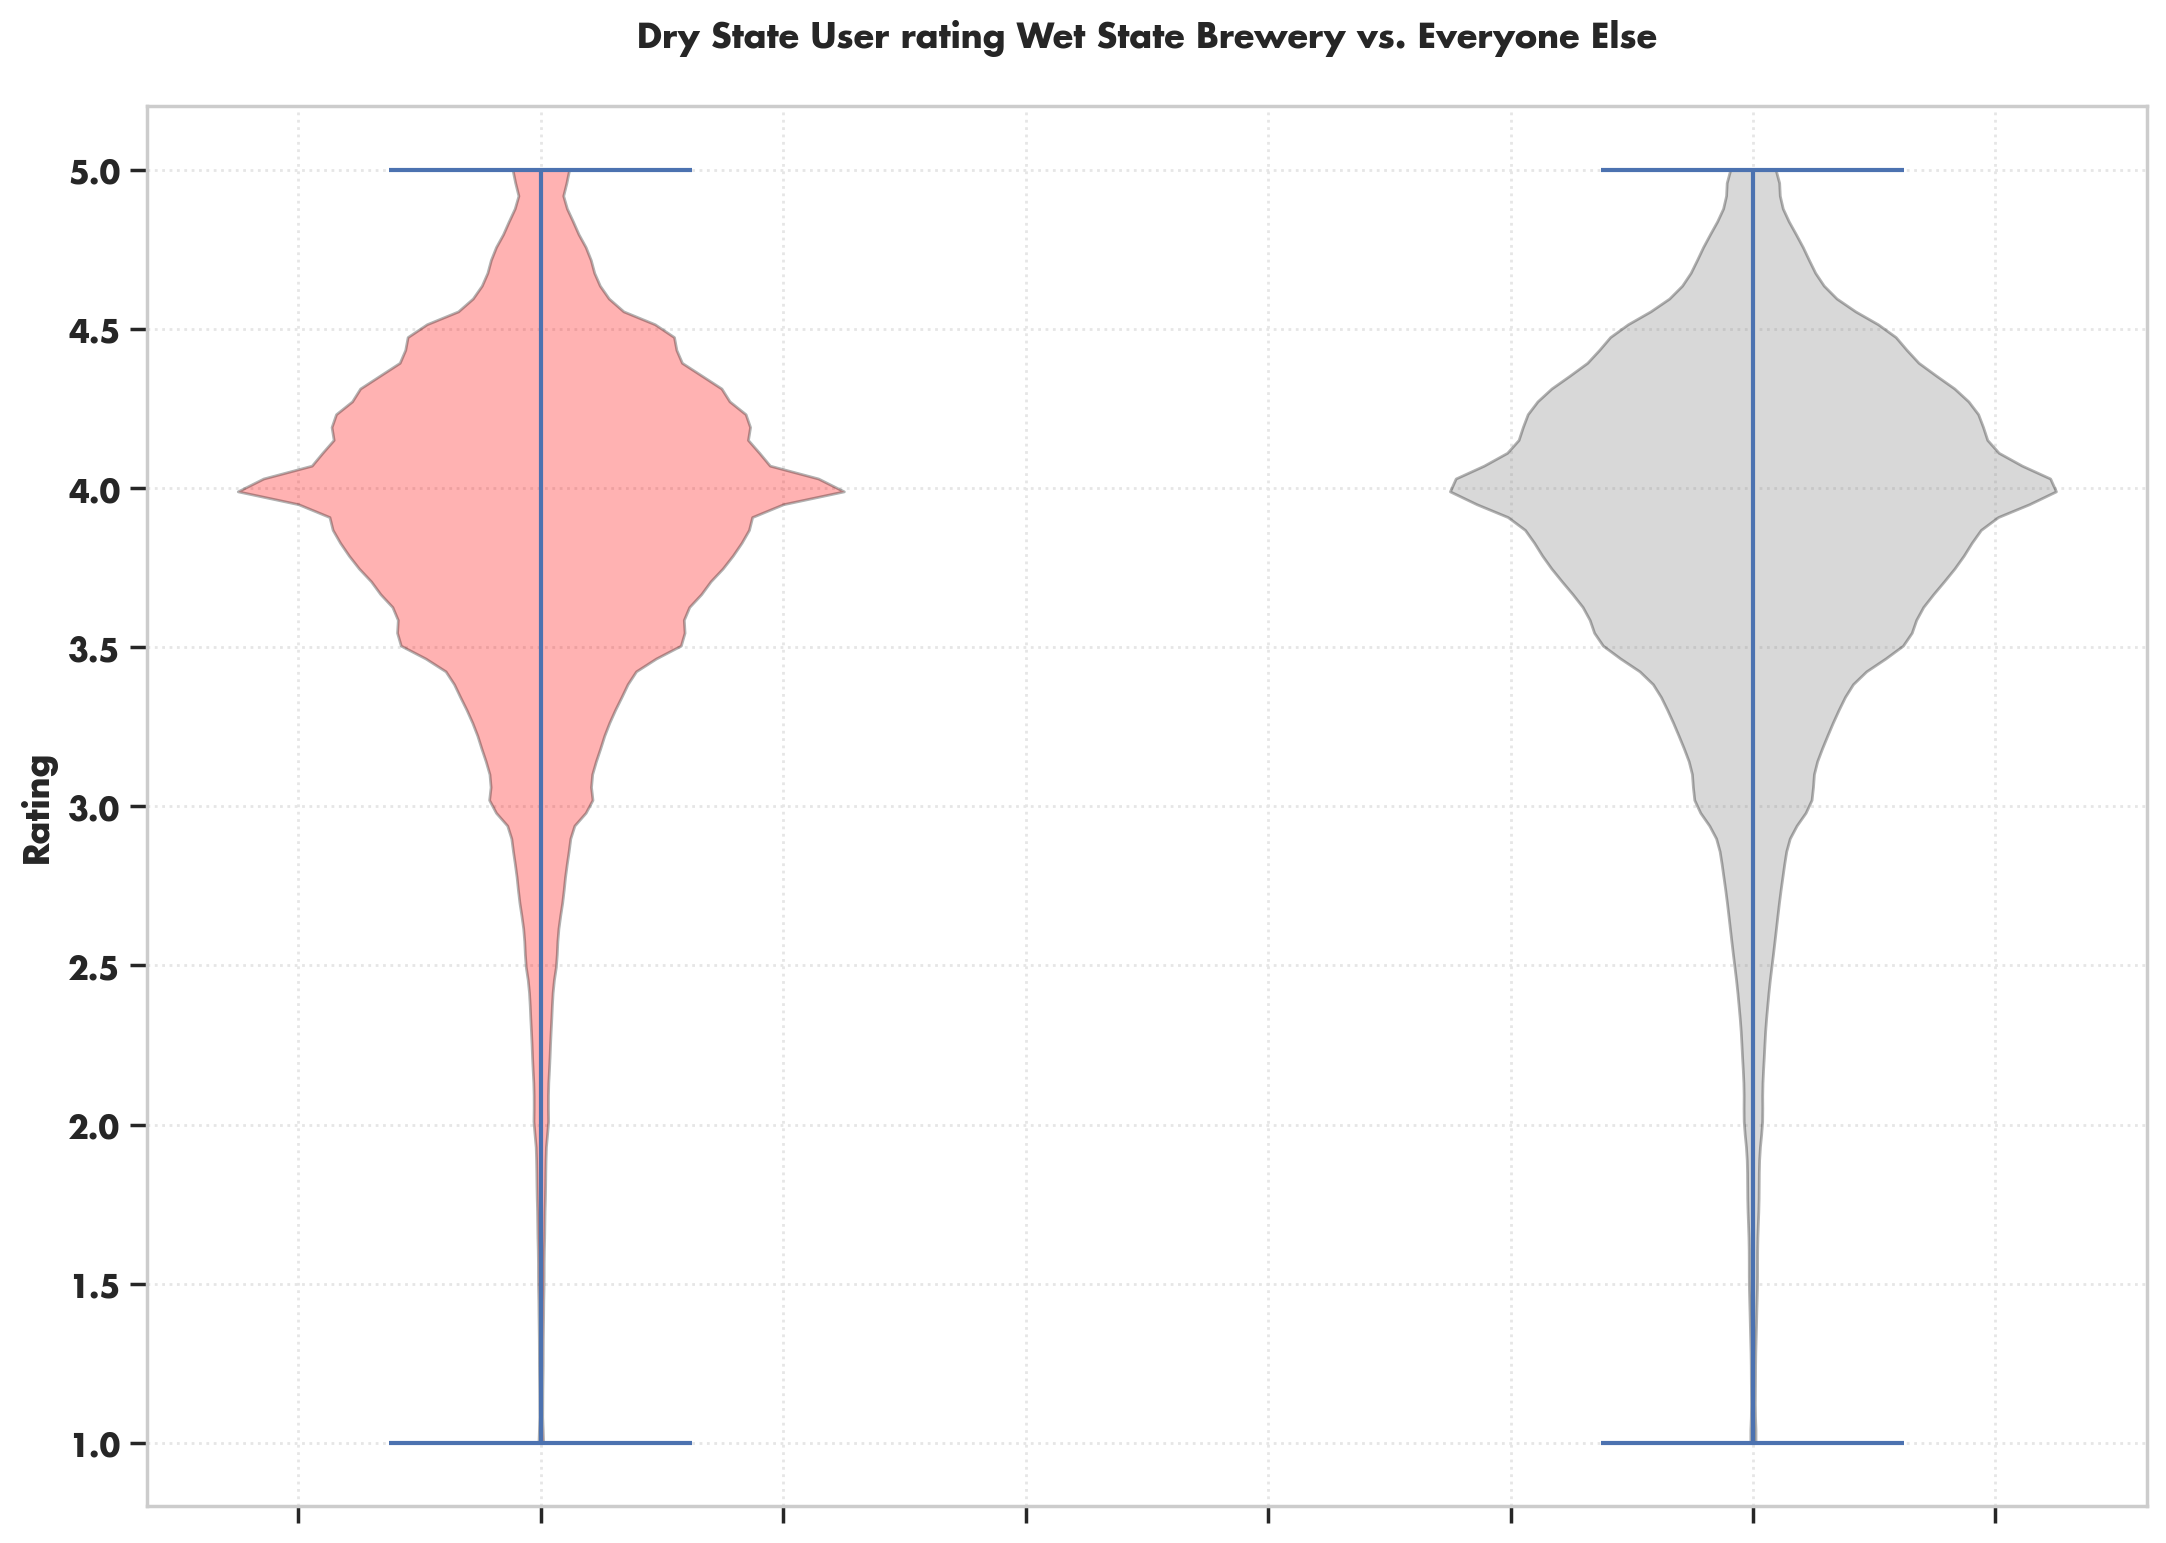
A linear regression with this attribute yields a t-statistic of -10.70 (with a p-value of 1x10-26), which is even more statistically significant and confirms our initial hypothesis. For the independent t-test comparing the means, we obtain the same p-value.
| t-statistic | p-value | |
|---|---|---|
| Dry State Rating vs. Wet State Rating | -8.45 | 3 x 10-17 |
| Dry state user, Wet State Brewery vs. Everyone Else | -10.70 | 1 x 10-26 |
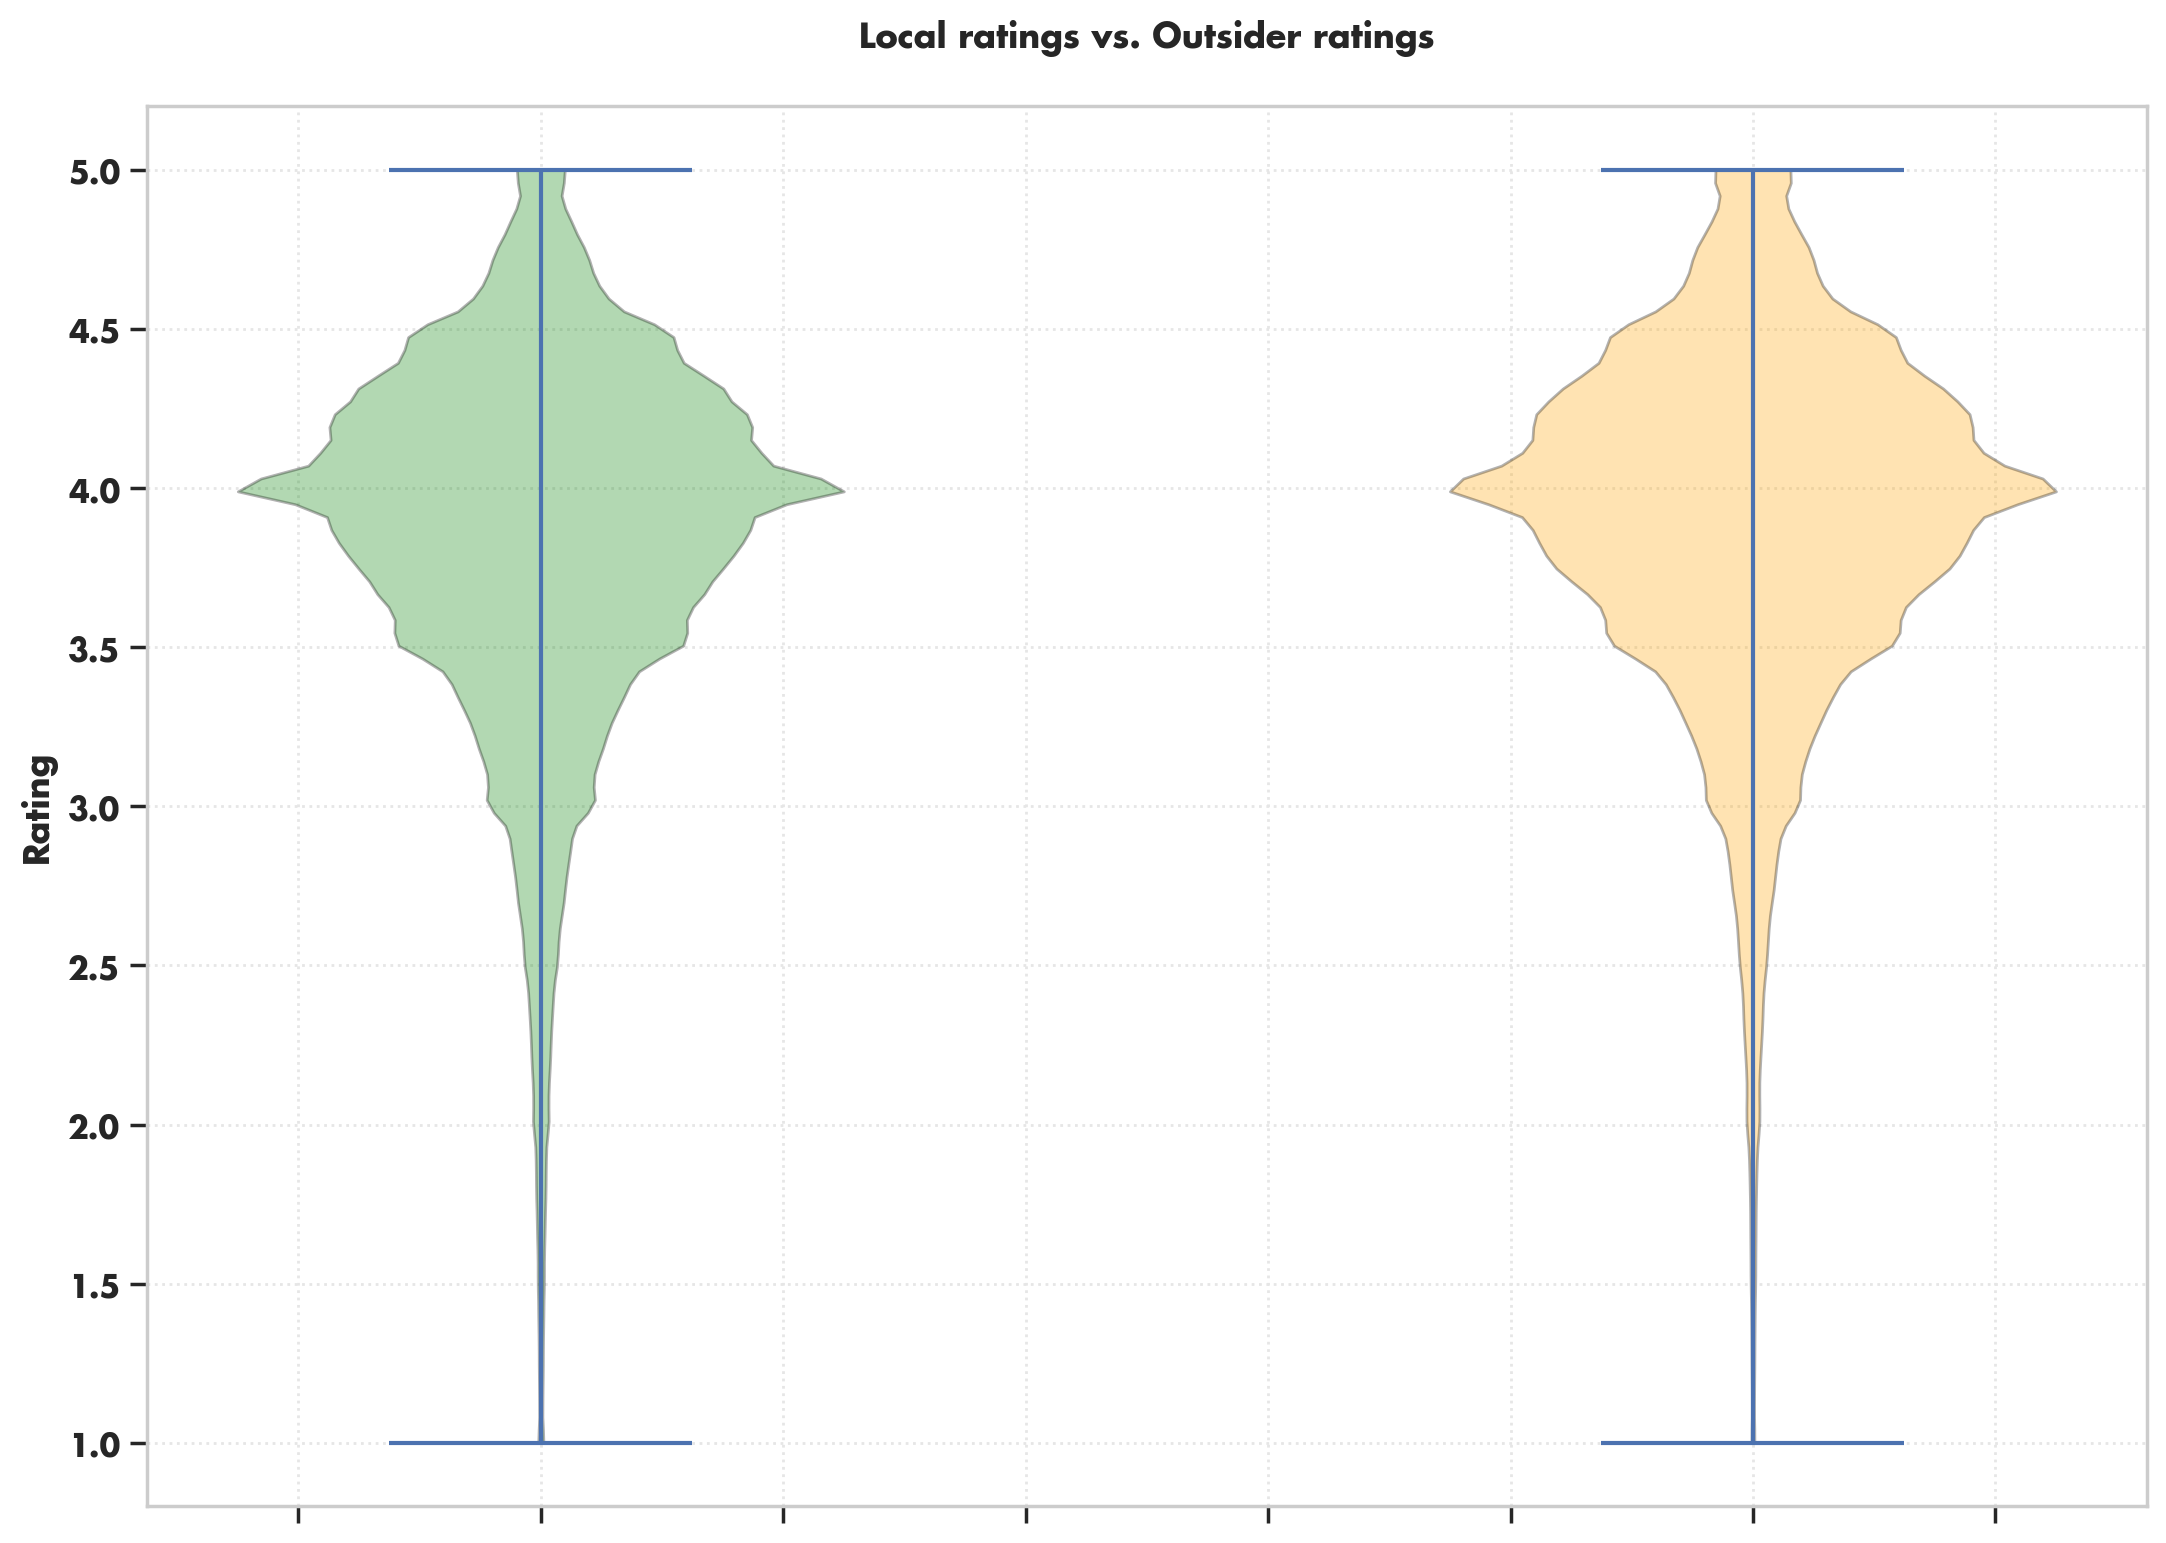
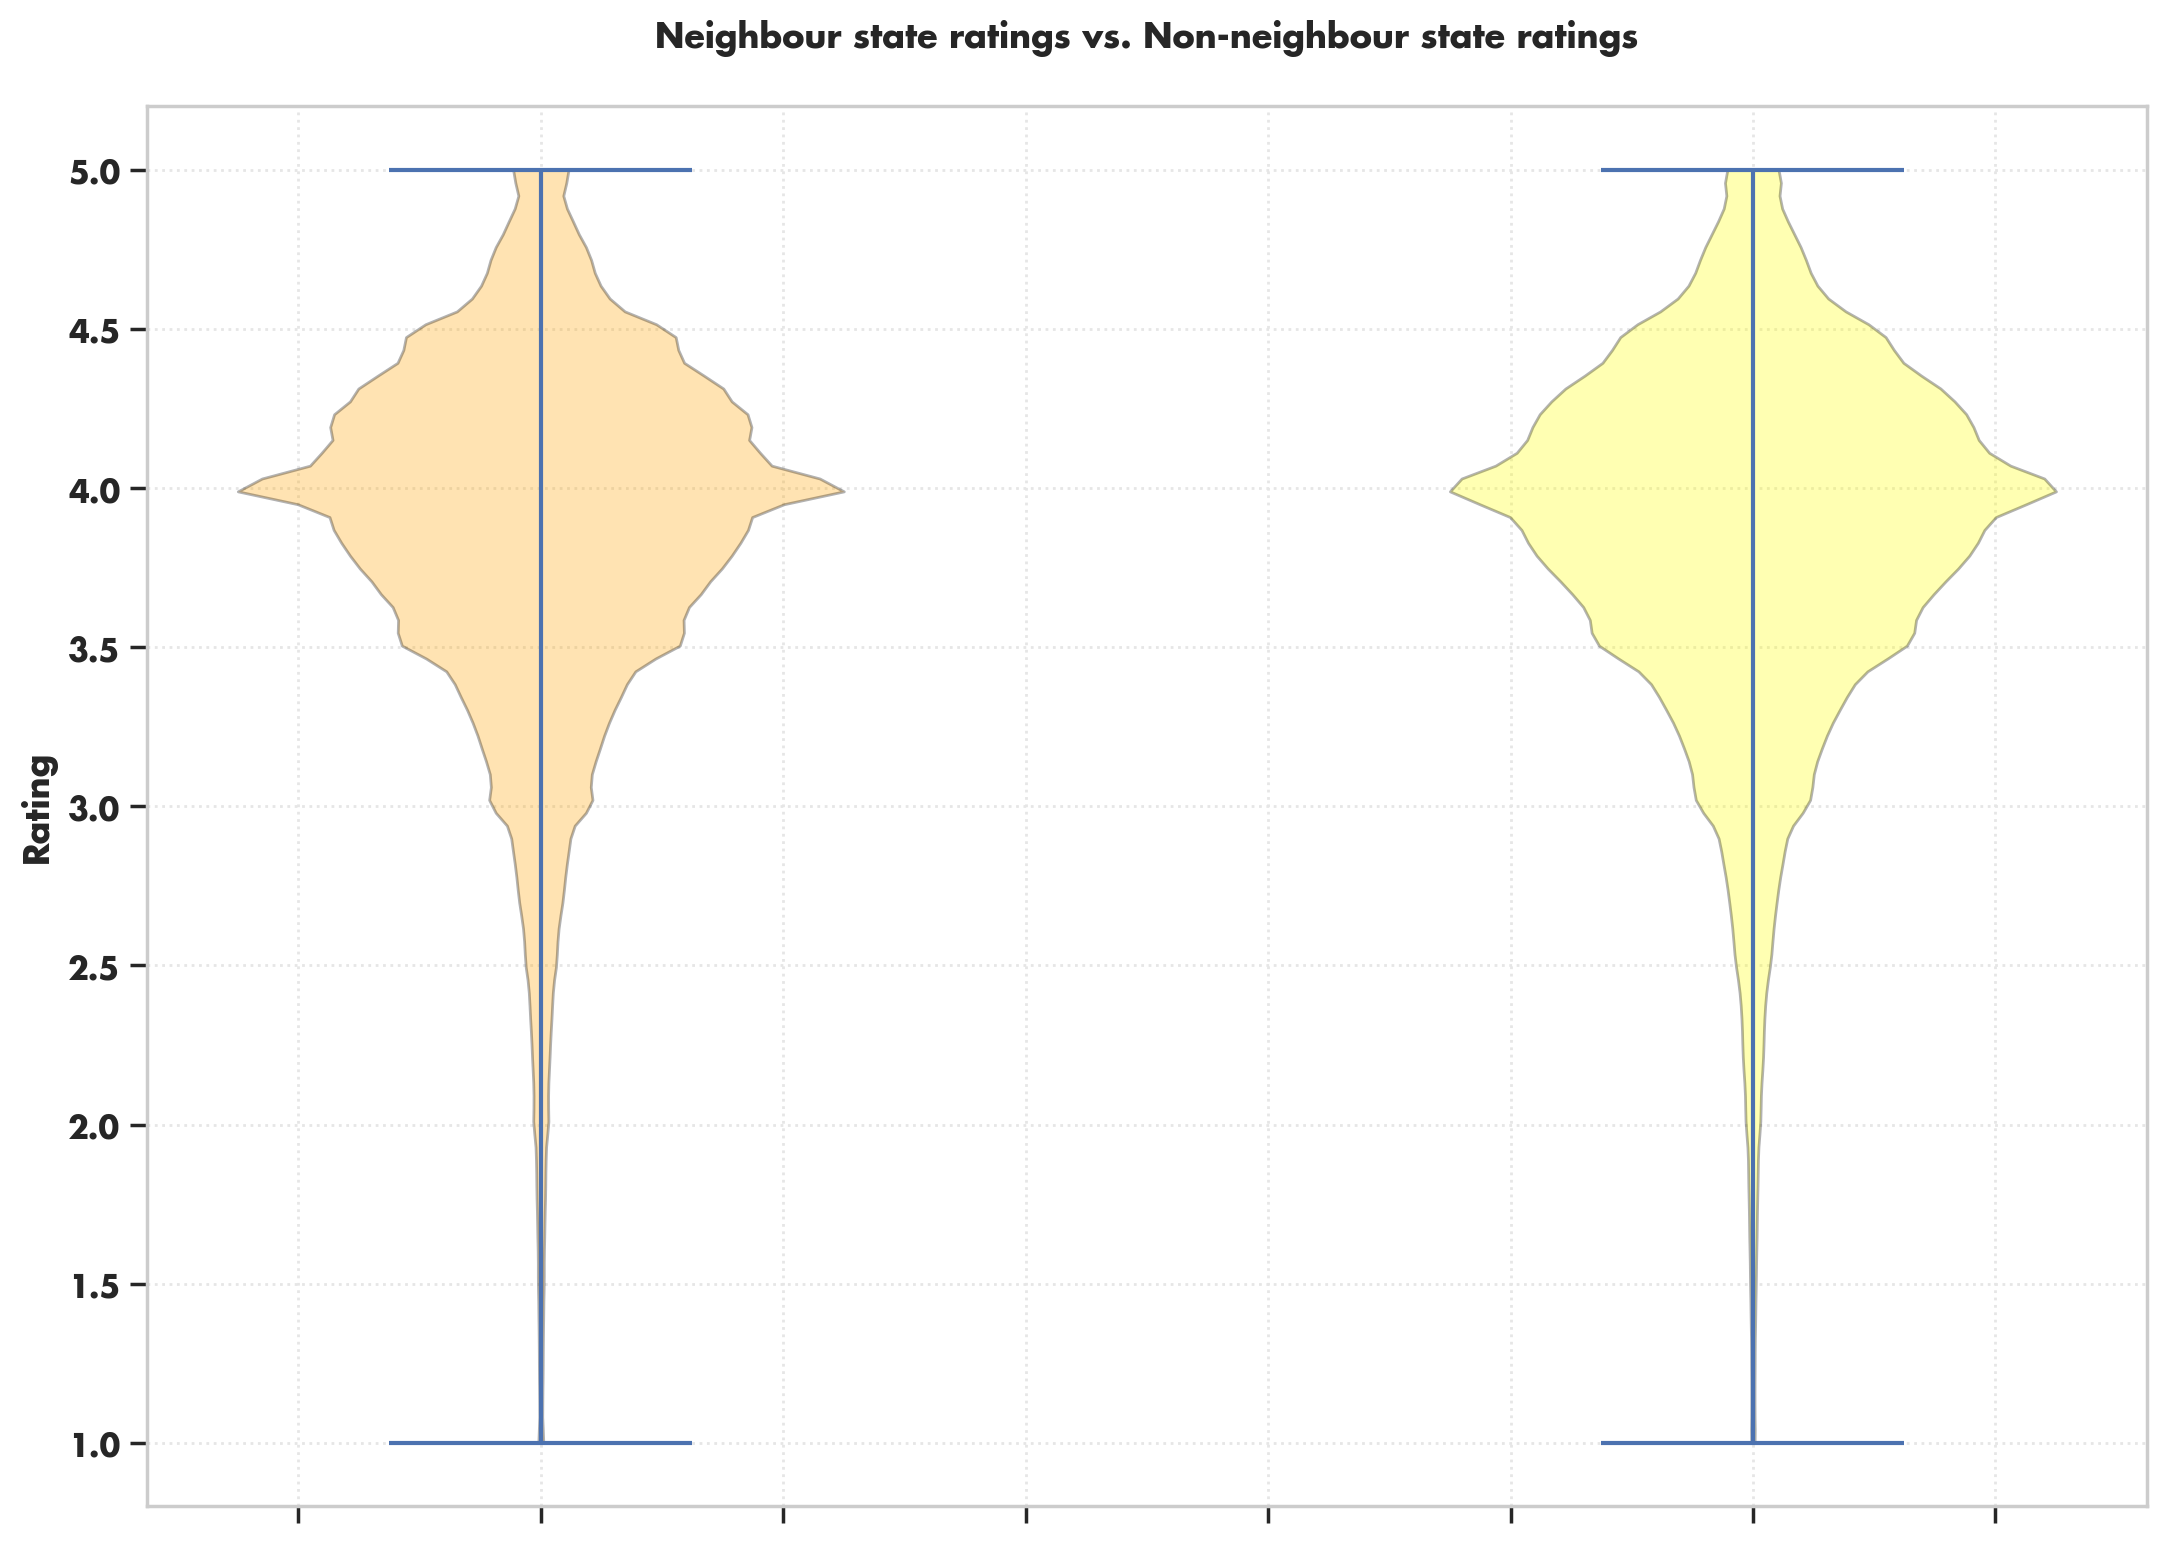
In the same vein, we decided to explore other factors which may influence the rating of the beer depending on the user location. First, we hypothesize that people are more likely to give favourable reviews to beer that comes from the same state as the author of the rating. Second, we speculate that users are likely to give negative reviews to beers that come from their respective neighbouring states. For example, a user from California is expected to give a positive review to Californian beer and a negative review for beer from Nevada. As with the previous categorical attributes, we test these hypotheses with a linear regression and an independent t-test. For the local beer reviews, we obtain a positive correlation between writing a review for local beer and giving a high overall rating. The t-statistic corresponding to this attribute is 51.775 (with a p-value of 0.00 – a negligible numerical error), which is statistically significant and confirms our initial hypothesis. For the independent t-test comparing the means, we obtain the same p-value.
For the neighbouring state beer reviews, we obtain a negative correlation with the final rating score. The t-statistic corresponding to this attribute is -11.444 (with a p-value of 2x10-30), which is statistically significant and confirms our initial hypothesis. We obtain the same p-value for the independent t-test.
| t-statistic | p-value | |
|---|---|---|
| Local vs. Outsider | 51.775 | 0.00 |
| Neighbour vs. Non-neighbour | -11.444 | 2 x 10-30 |
Sentiment Analysis
On our journey from the past to the present, we have endeavored to share facts from many different perspectives about beer. So let’s examine the sentiment analysis scores as an additional component of our data story.
This is the first question we need to ask. Why is sentiment analysis crucial to learn what
users think about beers? Because the only recollection we have of the past beer market is old maps and cool beer ads!
Technology advancements and the widespread use of websites like Beer Advocate and Rate
Beer have greatly facilitated people’s previous beer experiences. Can we, therefore, observe
how negative the review content is if a beer has a low rating or how positive the review
content is if a beer has a high rating when analyzing the positive or negative feelings of
people’s remarks regarding any beer?
In the subsequent sentiment analysis, we used the twitter-XLM-roBERTa-base for
Sentiment Analysis model developed by cardiffnlp.
This is a multilingual NLP model that has been optimized for sentiment
analysis using training data from 198M tweets.
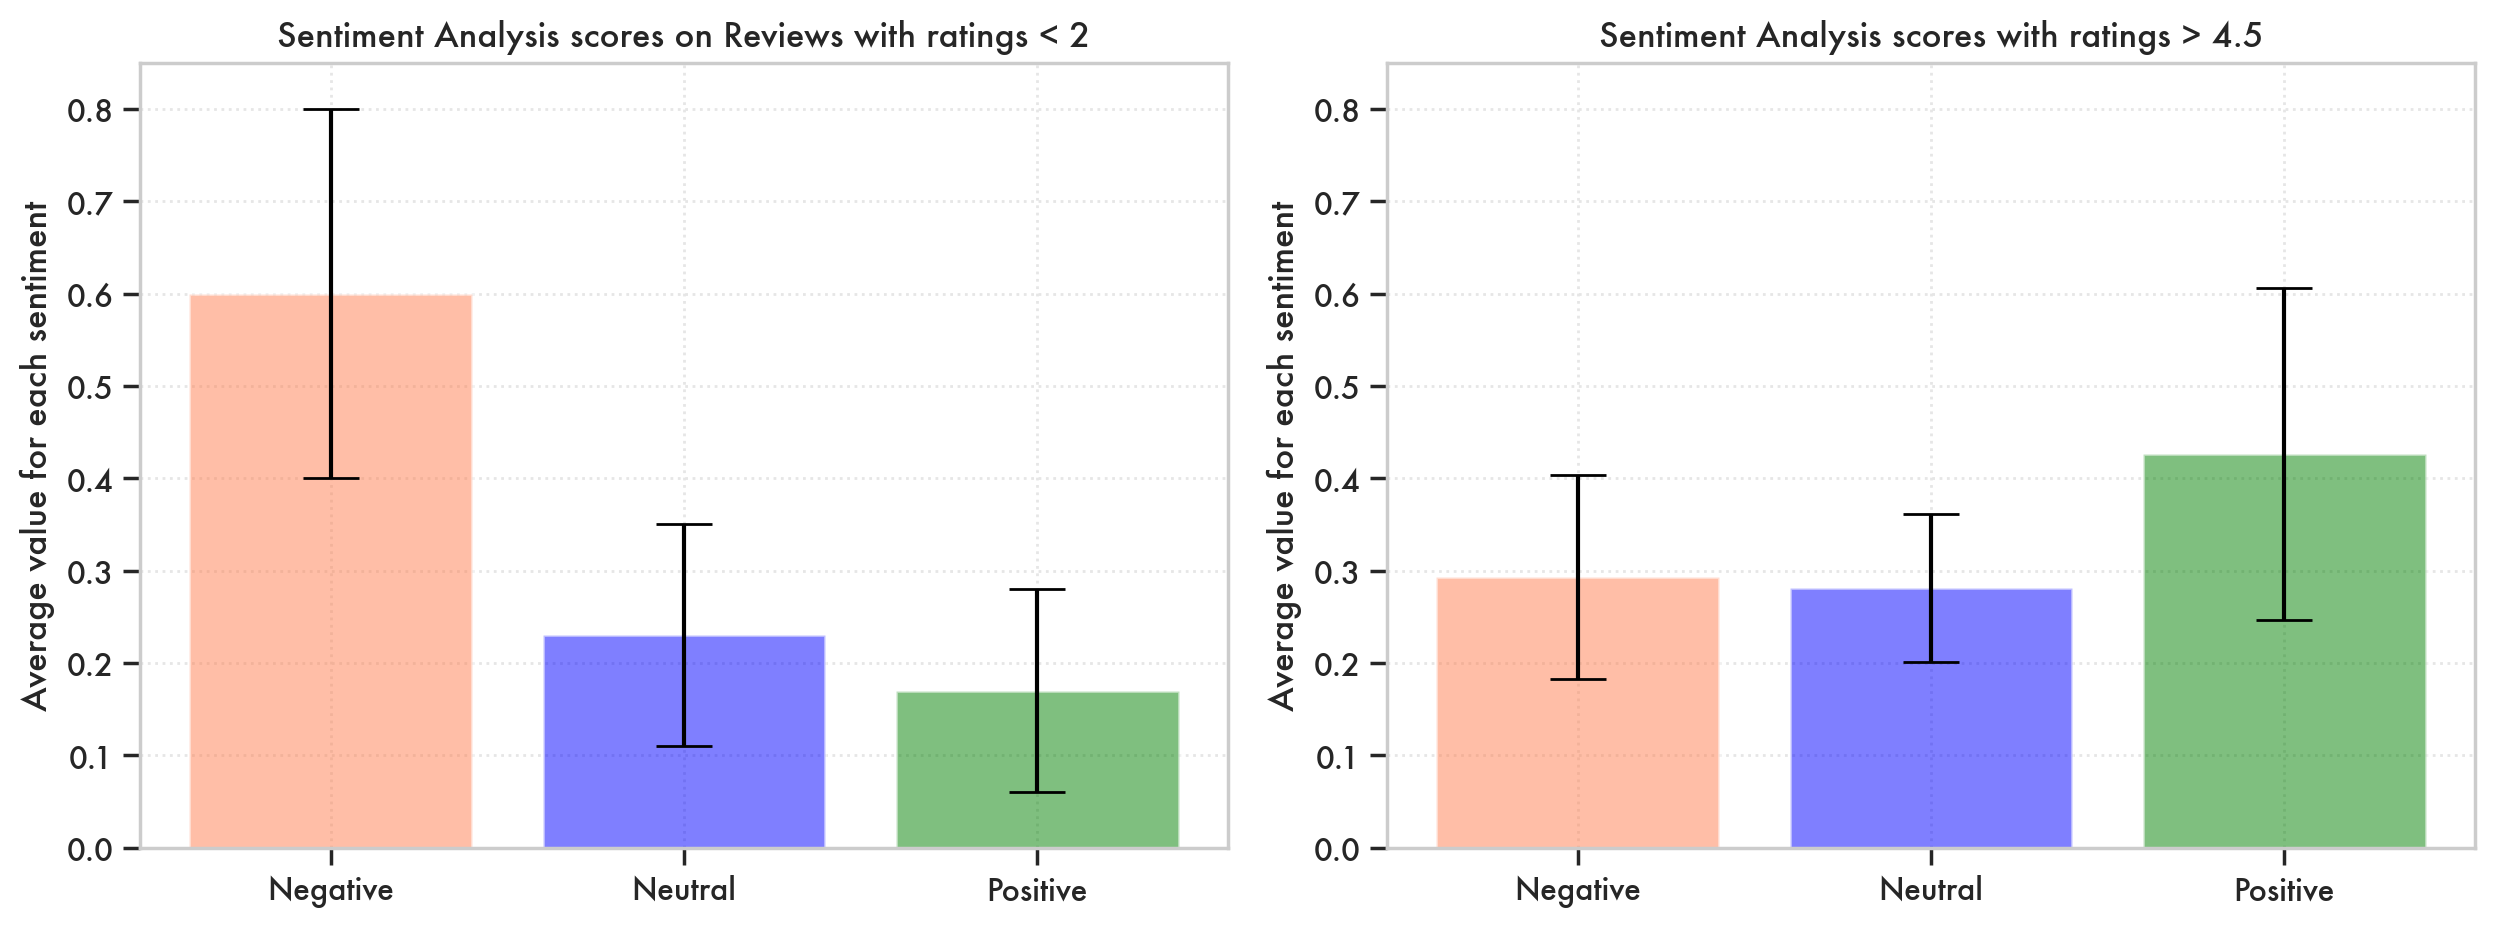
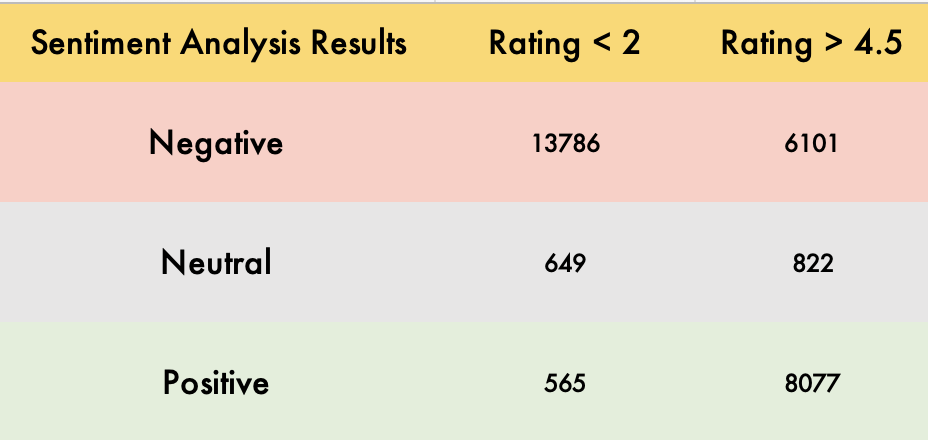
Looking at the figures above, we can see that for reviews with a rating of less than 2, the
average negative sentiment score prevails with 0.6, thrice the neutral or positive scores.
In comparison, rating of more than 4.5 have an average positive sentiment of 0.4 and an average negative sentiment of 0.3. This would mean that good ratings contain more negative sentiments than bad ratings contain positive sentiment.
Now let’s examine the sentiment scoring of sentiment analysis which is done using the pre-trained model twitter-XLM-roBERTa-base by taking a look at a few examples.
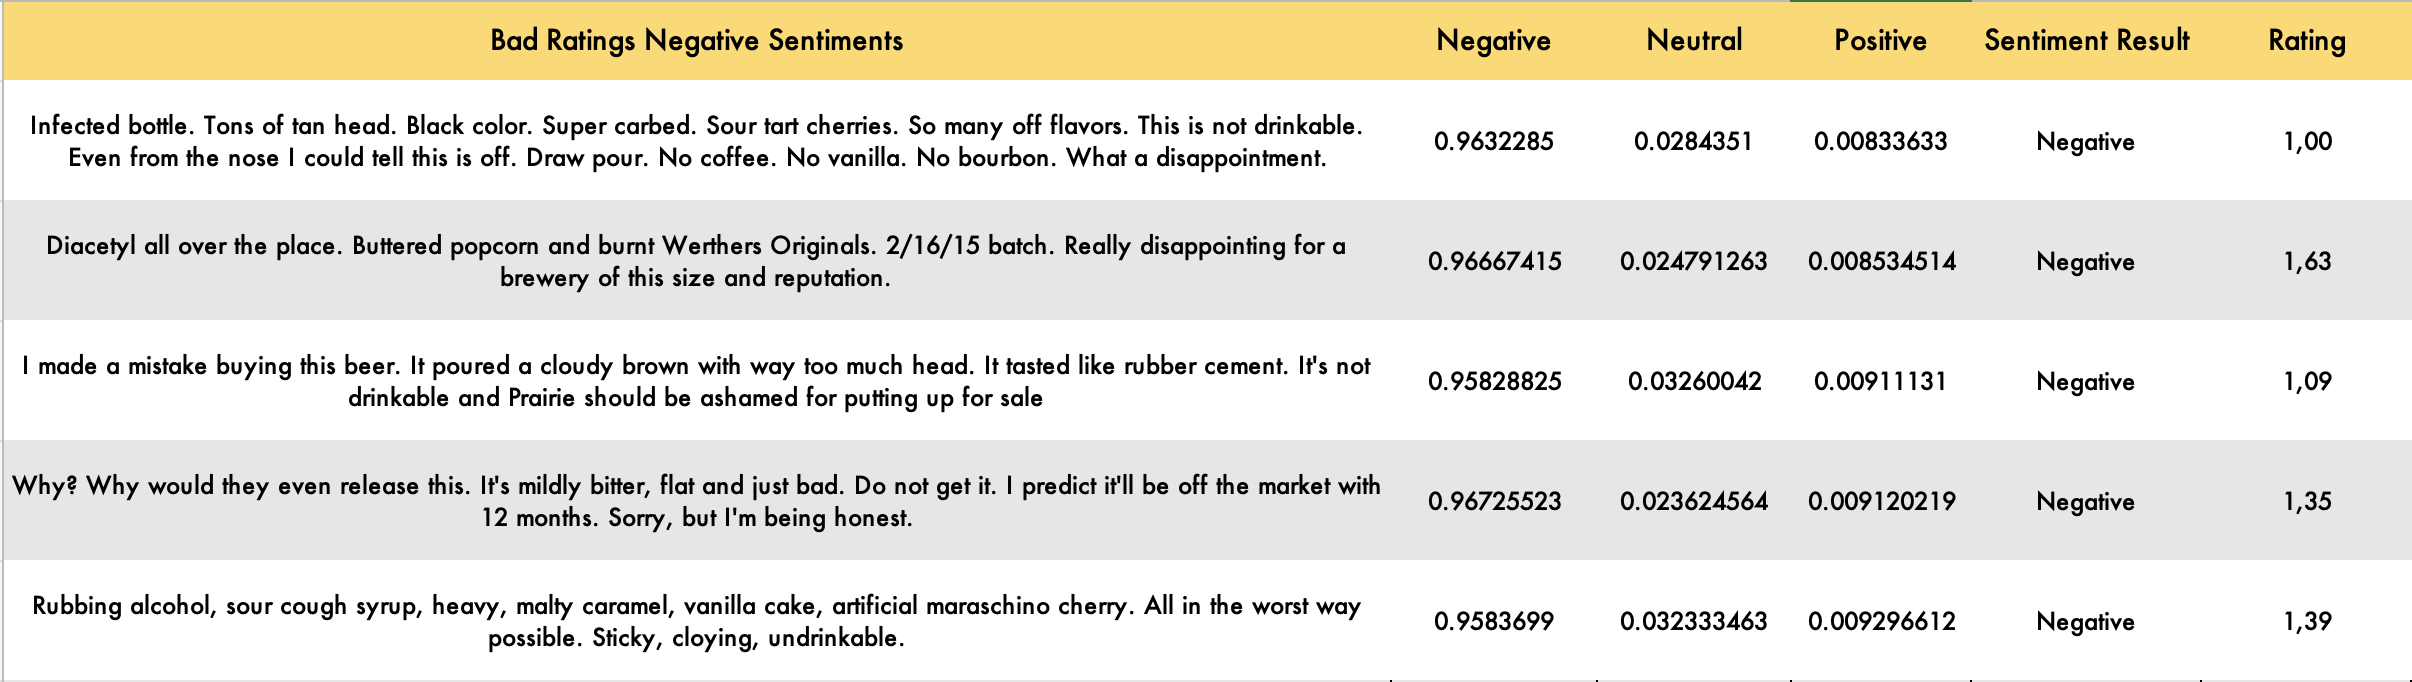
Here, the reviews that have the top 5 highest Negative sentiment score is displayed as a figure. As you can see the reviews include very negative language where disappointment emotions are displayed extensively.
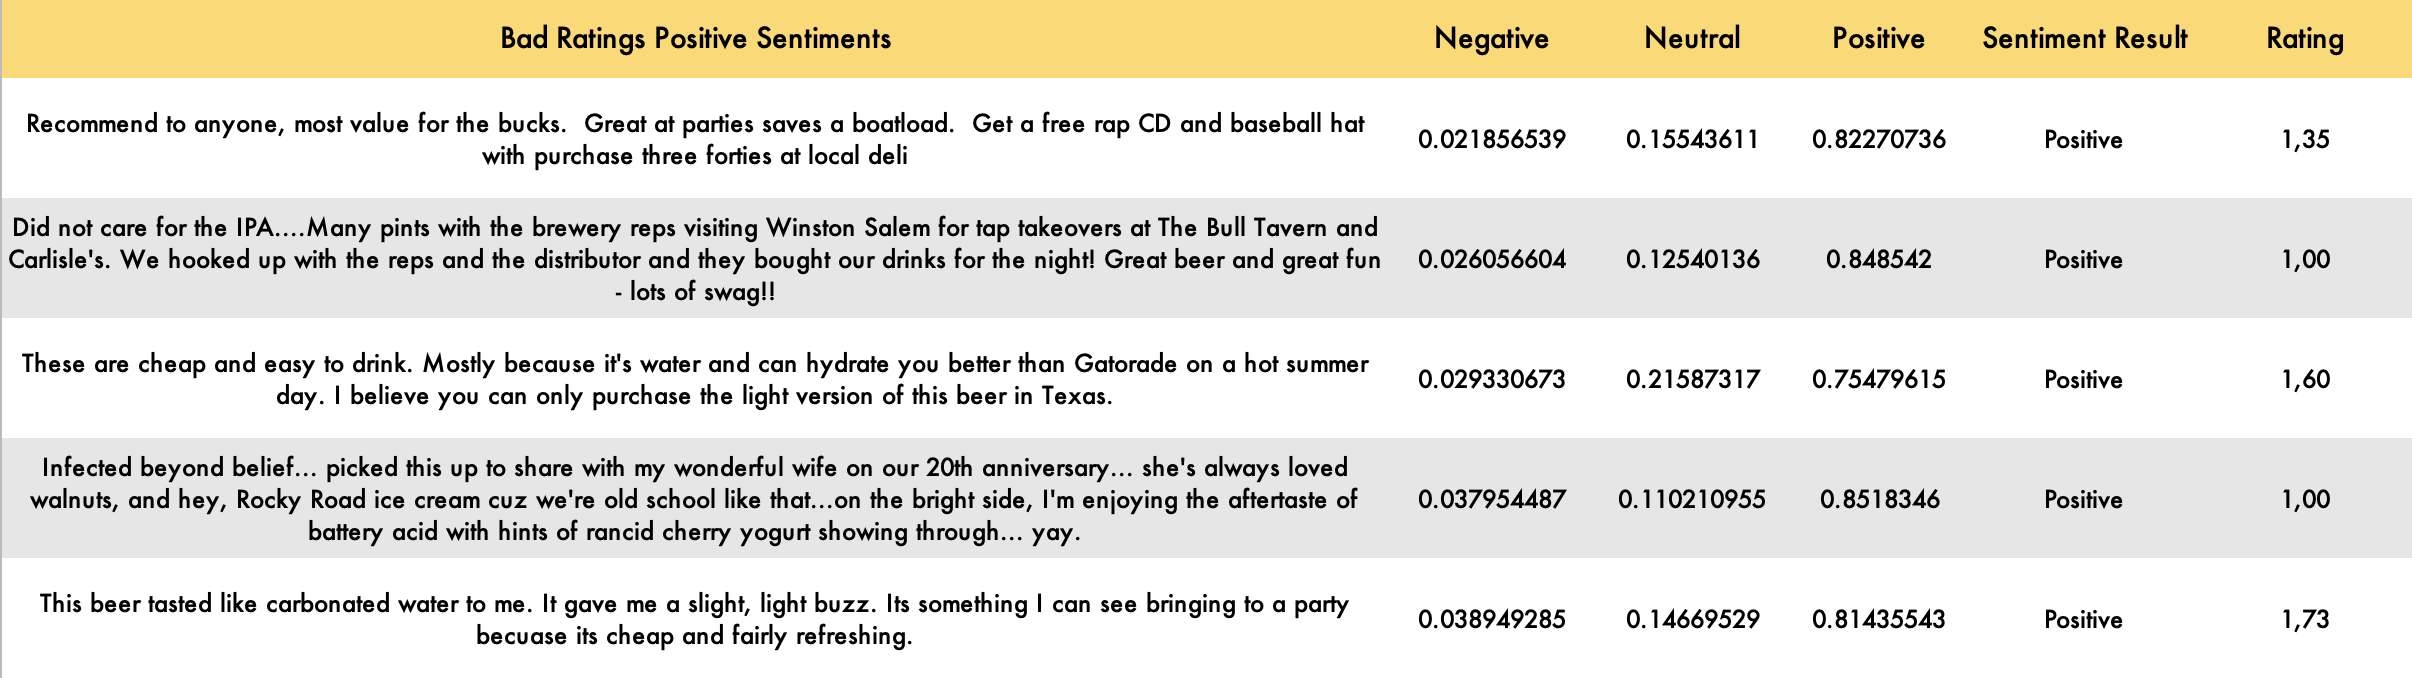
Here, you can see the content of the reviews does not include negative values when you concern it with respect to words used in them. However, when you check by its content, you can see that people reviewed beers with sarcasm. Since the model checked the content of the reviews without putting effort on detecting sarcasms, the reviews got a high positive sentiment score.
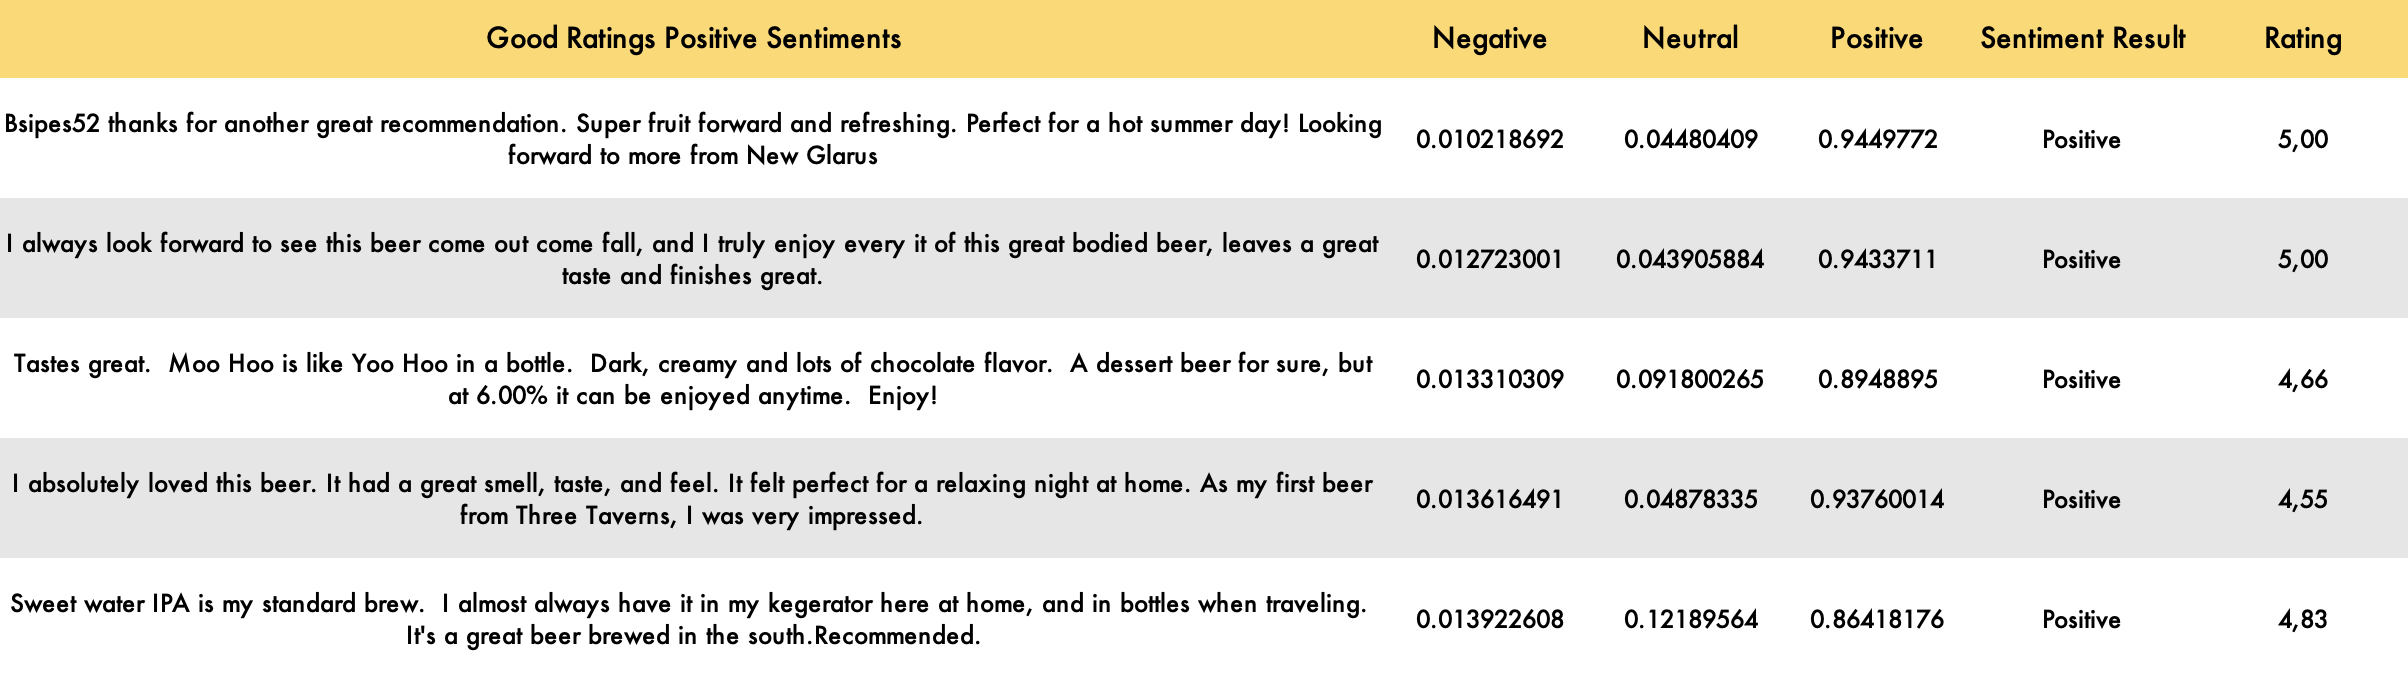
You can see the good reviews that got high positive sentiment scores and share positive thoughts about beers they experienced.
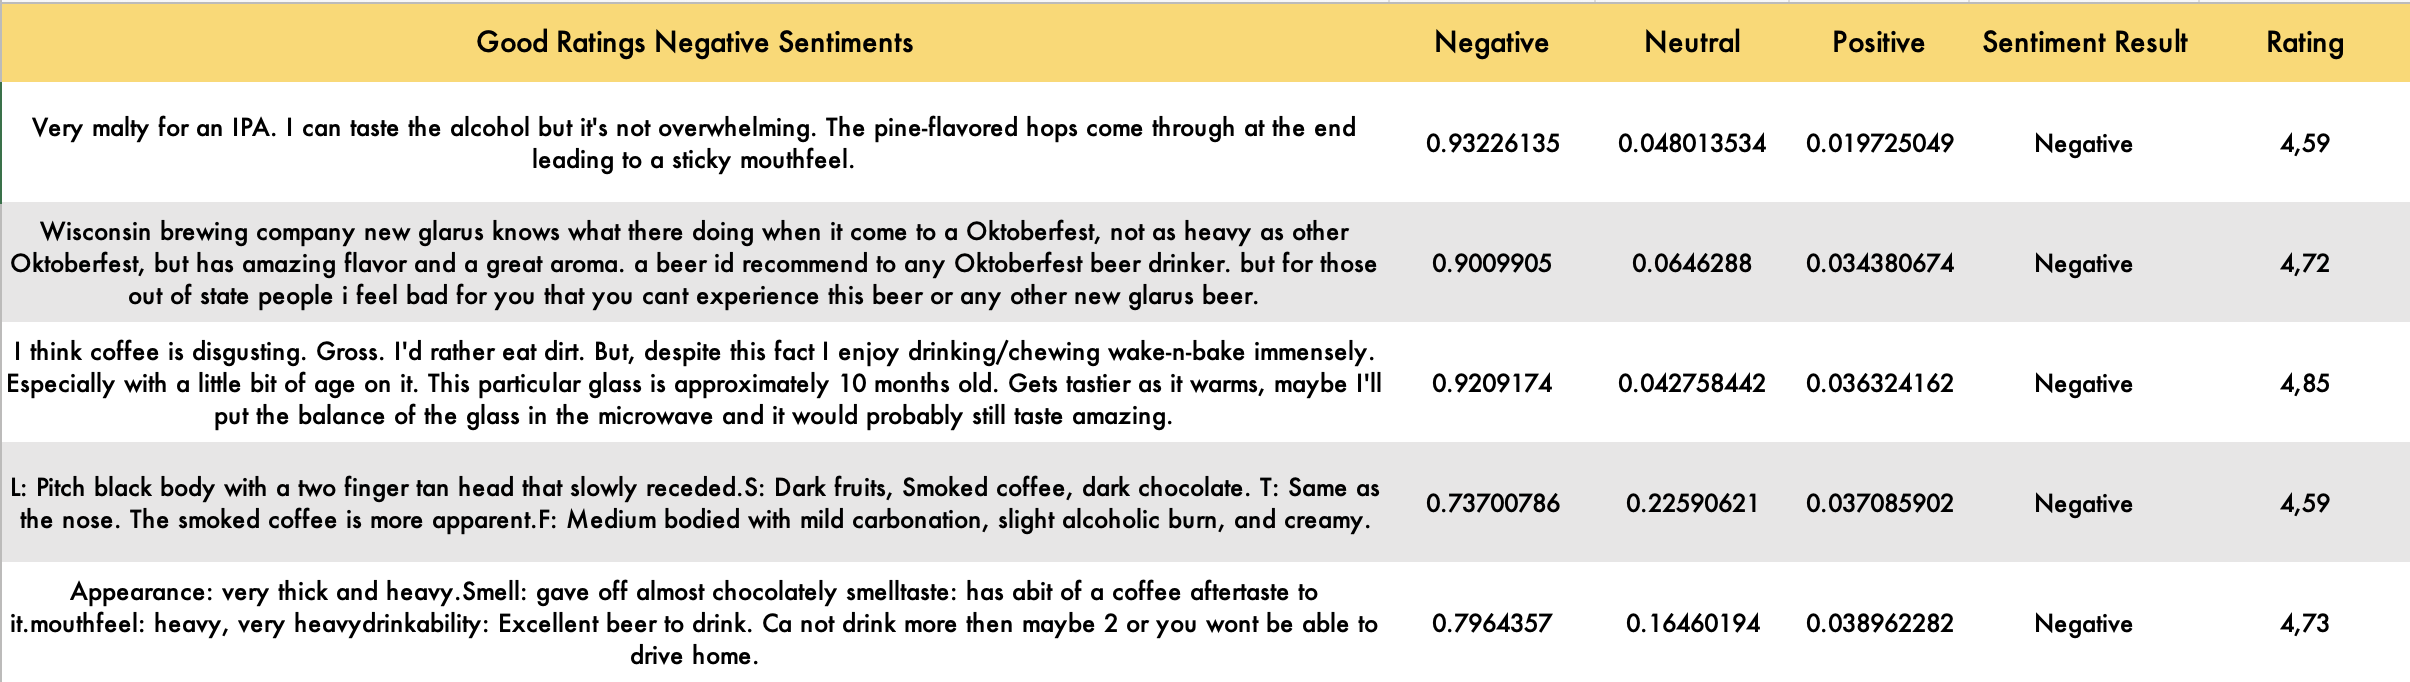
We observed that the rating scores we can see in the reviews here are very high, and as in the example, we observed that the negative sentiment score was high, in which several reviews that got high ratings were included in sentiment analysis. When we examine the examples to understand the situation, we can see that they compare them with other bad tastes or praise the beer they drink using irony. For this reason, the negative sentences it contains during sentiment analysis or the comparisons made by giving bad examples to praise the product at the beginning are the main factors that cause this result.
Now, let’s check the sentiment results of reviews with extreme ratings, namely ratings under 2 or above 4.5:
When we look at the results here, we observe that the sentiment prediction of the NLP model
we use about the interpretation with a low rating is mostly negative, while the tendency to
predict positive for high ratings is not the same.
Thus, we observe that while people have a tendency to use negative vocabulary
in reviews where they give low ratings, using positive vocab in high-rated reviews is not as
dominant as the first case, and the use of negative vocabulary in high-rated comments is often
close to positive vocab usage.
This is an important example that shows that people can approach beers from many different
perspectives and that if a beer is bad, everyone can say that it is bad in general, but if it is a
good beer, people can approach a beer to be good from many different angles depending on
their taste or personal preferences. The difference is stark between the past and the present: the memories we have from back in the day are smiling, positive ads that market beer in the best light possible, while in the present, the Internet gives a platform to express what we really think. Truth and opinions can be expressed in different ways, and if we were to analyze reviews for future uses of the dataset, we have to be careful to take the human factor into consideration: less smiling ads, more sarcasm!
Conclusion
If all this talk about beer hasn’t made you feel like drinking one right now, I don’t know what will.
We’ve covered the history of American beer, until its actuality. We’ve seen that ale dominated back when beer was underground, and that it’s now trendy again in the US. We’ve also covered the lager revolution and seen that the German Belt is as involved in the beer scene as it used to be. We’ve remembered the dark days of the Prohibition, and we’ve studied its lasting impact on dry counties’ beer opinions. Furthermore, we saw that the local market is still relevant and that inter-state rivalry is still there. Finally, we’ve shown through sentiment analysis that users’ opinions aren’t just limited to numbers, and that we have to dig deeper into their review to know what they really think about beer.
References
[1] Beer Studies, North America Protohistory
[2] “A concised history of America’s brewery industry”, Martin H. Stack
[3] “The Lager Revolution in the United States”, Seeing The Woods
[4] “The Ku Klux Klan in the 1920s”, Bill of Rights Institute
[5] “These 9 states still have dry counties”, 24/7 Wall Street
[6] Sales Data (U.S. TTB and U.S. Commerce Department, 2022)
[7] Map of New Amsterdam, 1660
[8] “Wet and dry counties”, NABCA Research